The latest OECD report on corporate tax statistics shows, among other things, that African countries are more reliant on corporate tax revenue than OECD member countries
The OECD has just released its second edition of the Corporate Tax Statistics database1 which provides an understanding of corporate tax policies and an insight into the impact of Base Erosion and Profit Shifting (BEPS). This report forms the response to BEPS Action 11 aimed at measuring and monitoring the scale of BEPS and, importantly, the response to the OECD/G20.
The report provides insights on the following key areas: corporate tax revenues and rates; tax incentives for research and development (R&D); aggregated statistics collected via country-by-country reports; intellectual property regimes; controlled foreign company rules; and interest limitation rules.
Below are extracts from the report focusing on a comparison of African countries. Full details of the information collated by the OECD can be found in the full report
here.
Corporate tax revenues
Corporate tax revenues were 14.6% of total tax revenues on average across the 93 jurisdictions canvassed in 2017 and the share of these revenues as a percentage of GDP was 3.1% on average. Average corporate tax revenues were a larger share of total tax revenues in Africa (18.6% in the 26 jurisdictions canvassed) compared with 9.3% for OECD member countries.
The average of corporate tax was greater in the OECD countries (3.0%) compared with Africa (2.8%). Corporate tax revenues as a percentage of GDP reached their peak in 2008 (3.6%), declining between 2009 and 2010 to 3.1%, which reflects the impact of the global financial and economic crisis.
In Africa, the share of corporate tax in total tax decreased by more than five percentage points in the Democratic Republic of Congo and Nigeria between 2015 and 2016. Although this share rebounded slightly in 2017, it remained at a lower level than 2015. The corporate income tax share in these jurisdictions amounted to 20.8% (DRC) and 50.5% (Nigeria) of total taxation in 2015 and 19.6% (DRC) and 44.9% (Nigeria) in 2017. In these jurisdictions, where the exploitation of natural resources is a significant part of the economy, the changes were mainly driven by fluctuations in commodity prices.
In Egypt, Equatorial Guinea and Nigeria, corporate income tax revenue accounted for more than 25% of total tax revenue. The report concludes that differences in corporate tax revenues as a share of total tax revenues should not be interpreted as being related to BEPS behaviour, since many other factors are likely to be more significant.
Corporate tax revenues as a percentage of GDP also varied across jurisdictions. In 2017, the OECD and Africa (26 jurisdictions) averages were almost identical, with Africa at 2.8% of GDP compared with the OECD at 3.0%. For the 26 African jurisdictions canvassed, the relatively high average revenue share of corporate income tax compared with the relatively low average of corporate income tax as a percentage of GDP reflects the low amount of total tax raised as a percentage of GDP (average of 17.0%). This could reflect policy choices as well as other challenges associated with domestic resource mobilisation such as capacity and compliance levels.
Statutory income tax rates
Statutory CIT rates have been decreasing on average over the last two decades, although considerable variation remains among jurisdictions. The average combined (central and sub-central government) statutory tax rate for all canvassed jurisdictions was 20.6% in 2020, compared with 20.7% in 2019 and 28.0% in 2000.
Corporate tax rates in 21 jurisdictions were equal to or above 30% in 2020. India had the highest corporate tax rate at 48.3%, which includes a tax on distributed dividends. Almost all countries indicated a reduction in corporate tax rates, with no countries recording an increase.
In 2000, 13 countries had tax rates greater than or equal to 40%, with only India having a rate exceeding 40%. This had reduced to only one country (India) by 2020. Between 2000 and 2020, most corporate tax rates fell to between 10% and 30%. With the decline in tax rates, the number of countries with tax rates between 20% and 30% increased to 48, and those with tax rates between 10% and 20% trebled to 28. The grouping with the most significant decline has been the OECD (a decline of 9.0 percentage points, from 32.2% in 2000 to 23.2% in 2020) followed by the Africa (15) average with a decline of 7.0 percentage points, from 34.5% in 2000 to 27.5% in 2020. While the averages have fallen for each grouping over this period, there remains a significant level of difference between the averages for each group: the average corporate tax rate for Africa (15) was 27.5% in 2020, compared with 23.2% for the OECD.
Standard statutory CIT rates provide a snapshot of the corporate tax rate in a country. However, countries may offer different rates to certain industries and provide tax incentives. The Africa Tax Administration Forum has identified that tax incentives are a major issue for revenue collection across the continent.
The impact of tax incentives
Of the countries canvassed, 30 out of the 36 OECD members offered tax relief on R&D expenditures in 2019, compared with just 19 in 2000. The OECD has seen a shift in the policy mix towards a more intensive use of R&D tax incentives to deliver support for business R&D. South Africa continues to provide tax incentives for R&D.
Country by Country Reporting (CBCR)
CBCR was implemented as part of Action 13 of the OECD/G20 BEPS Project to assist countries to identify BEPS through perceived transfer pricing practices. The data collected from CBCRs can also play a role in supporting the economic and statistical analysis of multinational enterprises (MNEs).
South Africa is the only country included in the analysis. Below is an extract from the report of information collated on South Africa compared with other key countries (2016).
| | |
Sum of total/no of CBCR's (US$) | |
|
Reporting Jurisdiction |
Level of data disaggregation |
Number of CBCRs |
Unrelated party revenues |
Tangible Assets (non cash) |
Income Tax Accrued |
No of employees |
| South Africa | 126 Individual jurisdictions | 44 | 3,385 | 4,666 | 75 | 23,239 |
| Australia | 56 Individual jurisdictions | 110 | 5,034 | 4,547 | 150 | 12,989 |
| Canada | 9 Individual jurisdictions | 160 | 5,116 | 7,810 | 71 | 13,550 |
| China | 89 Individual jurisdictions | 82 | 41,201 | 83,294 | 882 | 172,714 |
| India | 162 Individual jurisdictions | 165 | 4,684 | 6,807 | 129 | 29,978 |
| USA | 137 Individual jurisdictions | 1101 | 10,209 | 5,646 | 239 | 25,239 |
In addition to the above, data was gathered on the accrued tax, based on a percentage of total national corporate income tax. The results for some of the above countries are illustrated below.
2
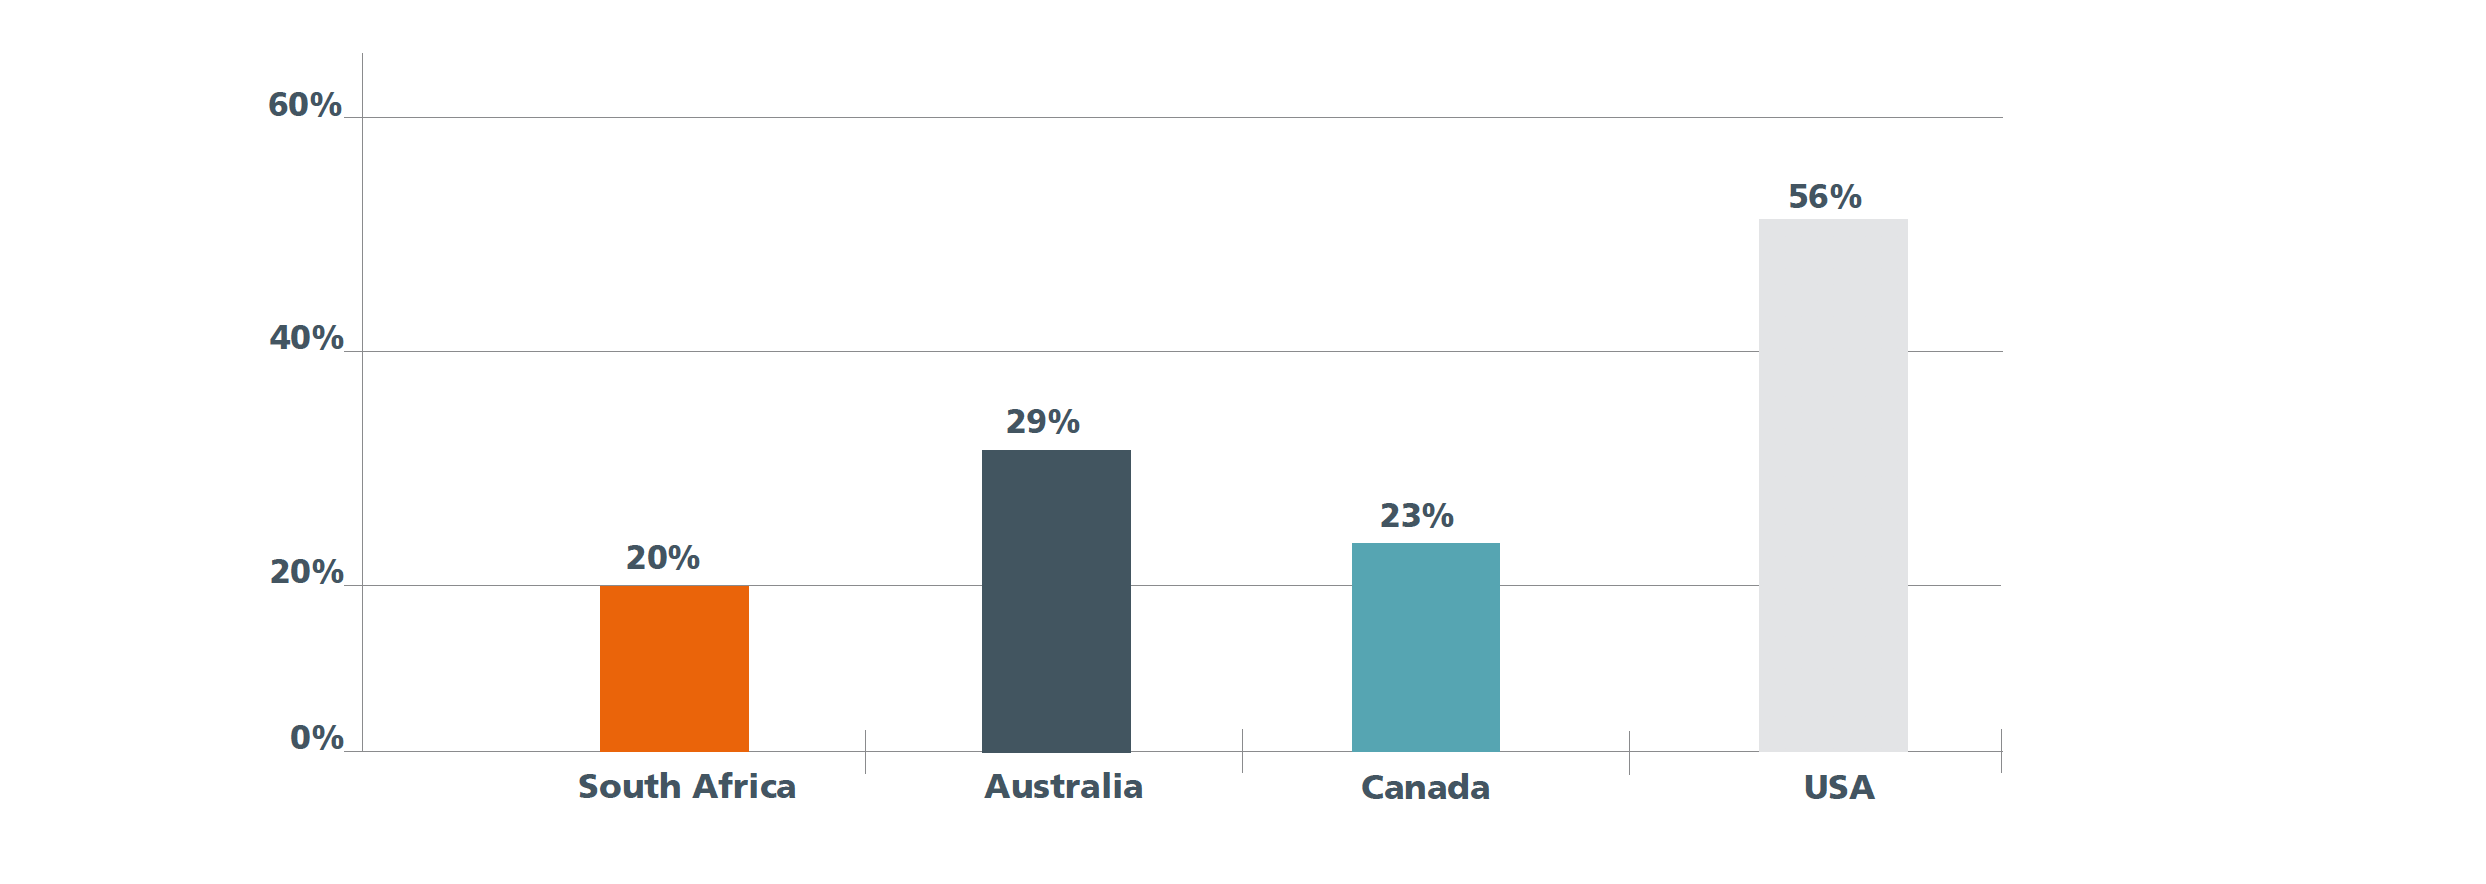
Other key observations recorded for all countries canvassed included:
- Revenue per employee tended to be higher where statutory corporate income tax rates are zero and in investment hubs. For example, the median value of revenue per employee is US$1.4 million in jurisdictions with a zero rate of corporate income tax compared with US$240,000 where the corporate income tax rate is less than 20%, and US$370,000 where the corporate income tax rate is higher than 20%.
- The share of related party revenues in total revenues is higher for MNEs in certain jurisdictions, notably investment hubs where related party revenues account for 40% of total revenue.
As envisaged, the data is being used by the OECD and tax administrations across the globe to assess BEPS risk. The report suggests that in 2016 there could have been a misalignment between the location where profits were reported and the location where economic activities occurred, suggesting there could be a transfer pricing risk.
Intellectual property regimes
The OECD has focused on the creation of value in intangible assets and where profits arising from its use should be captured. Data collected through the OECD Forum on Harmful Tax Practices (FTHP) has fed into much of this focus.
Fifty-one regimes have been identified and, of these, 32 have been reviewed by the FHTP. The IP regimes are classified as harmful (do not meet the nexus approach), not harmful (do meet the nexus approach) or potentially harmful (may not meet it but the impact is not yet assessed).
Of the regimes reviewed, the majority were found to be "not harmful". Thirty-seven regimes in total were found to be not harmful and 22 of these regimes were found to be not harmful after having been amended to align with the Action 5 minimum standard.3 Three regimes are in the process of being amended or eliminated as currently not compliant and ten regimes remain under review.
Among the 37 regimes found to be not harmful, the tax benefit offered ranges from a full exemption to a reduction of about 40% of the tax rate that would have otherwise applied. The most common reduction is a 50% reduction. Included in these is China, which offers a reduced rate of 15%, India (10%), Mauritius (full exemption) and the UK (10%).
Interest limitation rules
South Africa has a myriad of interest limitation rules and is currently reviewing its policy on these as indicated in National Treasury's request for comments in February 2020.4 This is in response to the OECD/G20 BEPS Action 4.5
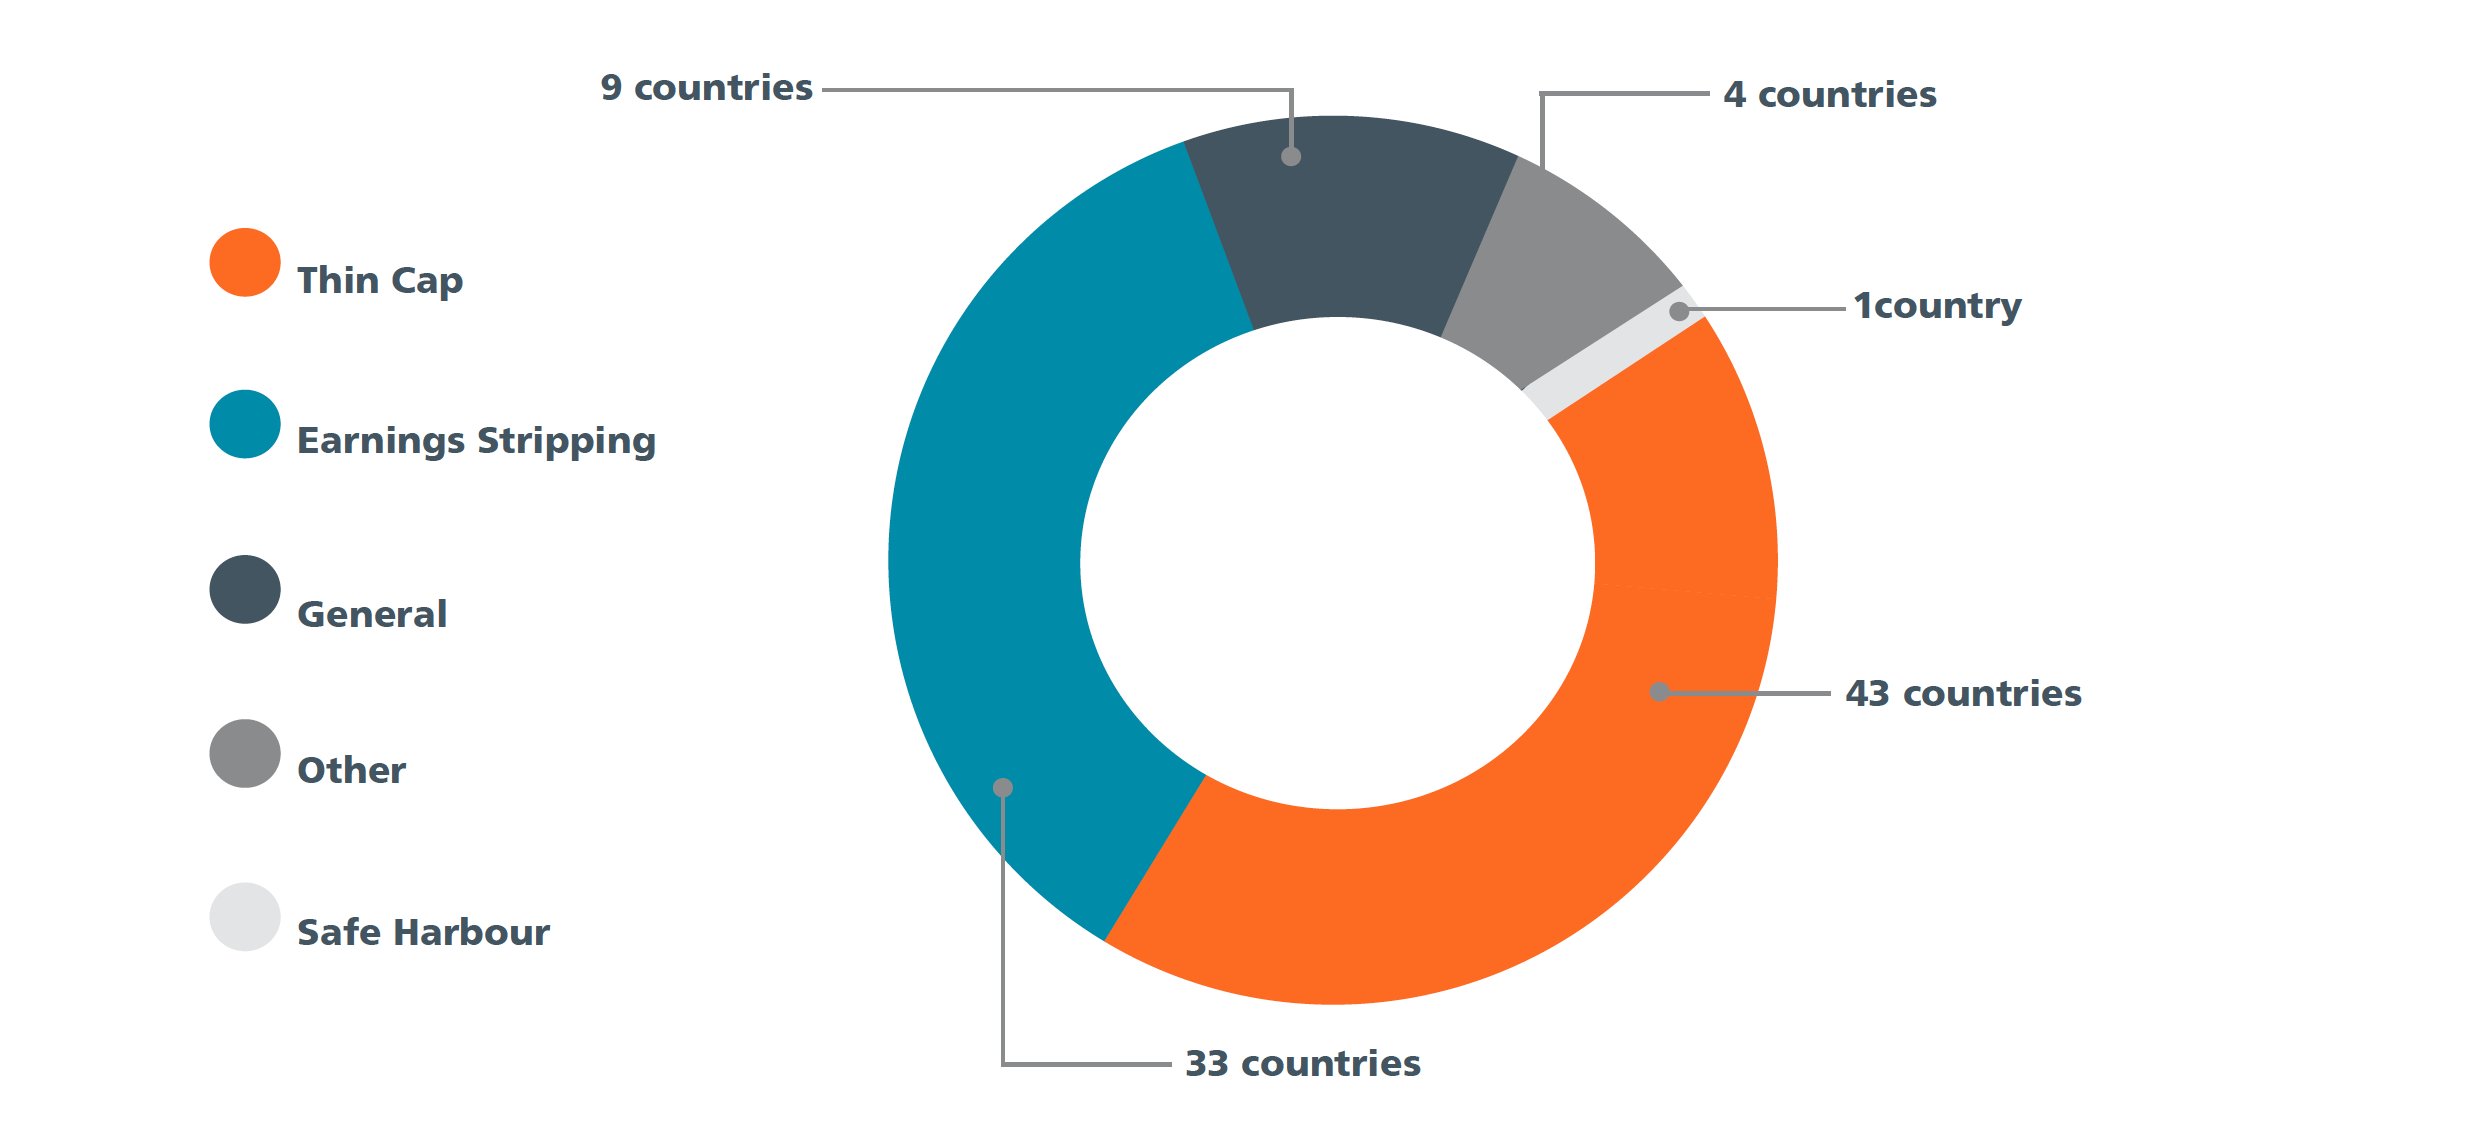
Information on the presence of interest limitation rules is available for 134 Inclusive Framework member jurisdictions. Of these, 67 indicated that interest limitation rules were in place in 2019. Many jurisdictions reported having more than one interest limitation rule in place. Interest limitation rules take a variety of forms. Of the 67 jurisdictions that had interest limitation rules, the most common was thin capitalisation rules (43), followed by earnings stripping rules (33). Among these jurisdictions, the most commonly referenced ratio was interest-to-EBITDA (30), with ratio values ranging from 10% to 30%, with the latter being the most common.
Controlled Foreign Company (CFC) Rules
South Africa, along with most countries which adopt a residence basis of taxation, has adopted CFC rules. These are intended to ensure the taxation of certain categories of MNE income in the jurisdiction of the parent company to counter certain offshore structures that result in no or indefinite deferral of taxation. The 2015 BEPS Action 36 report set out recommended approaches to the development of controlled foreign company (CFC) rules.
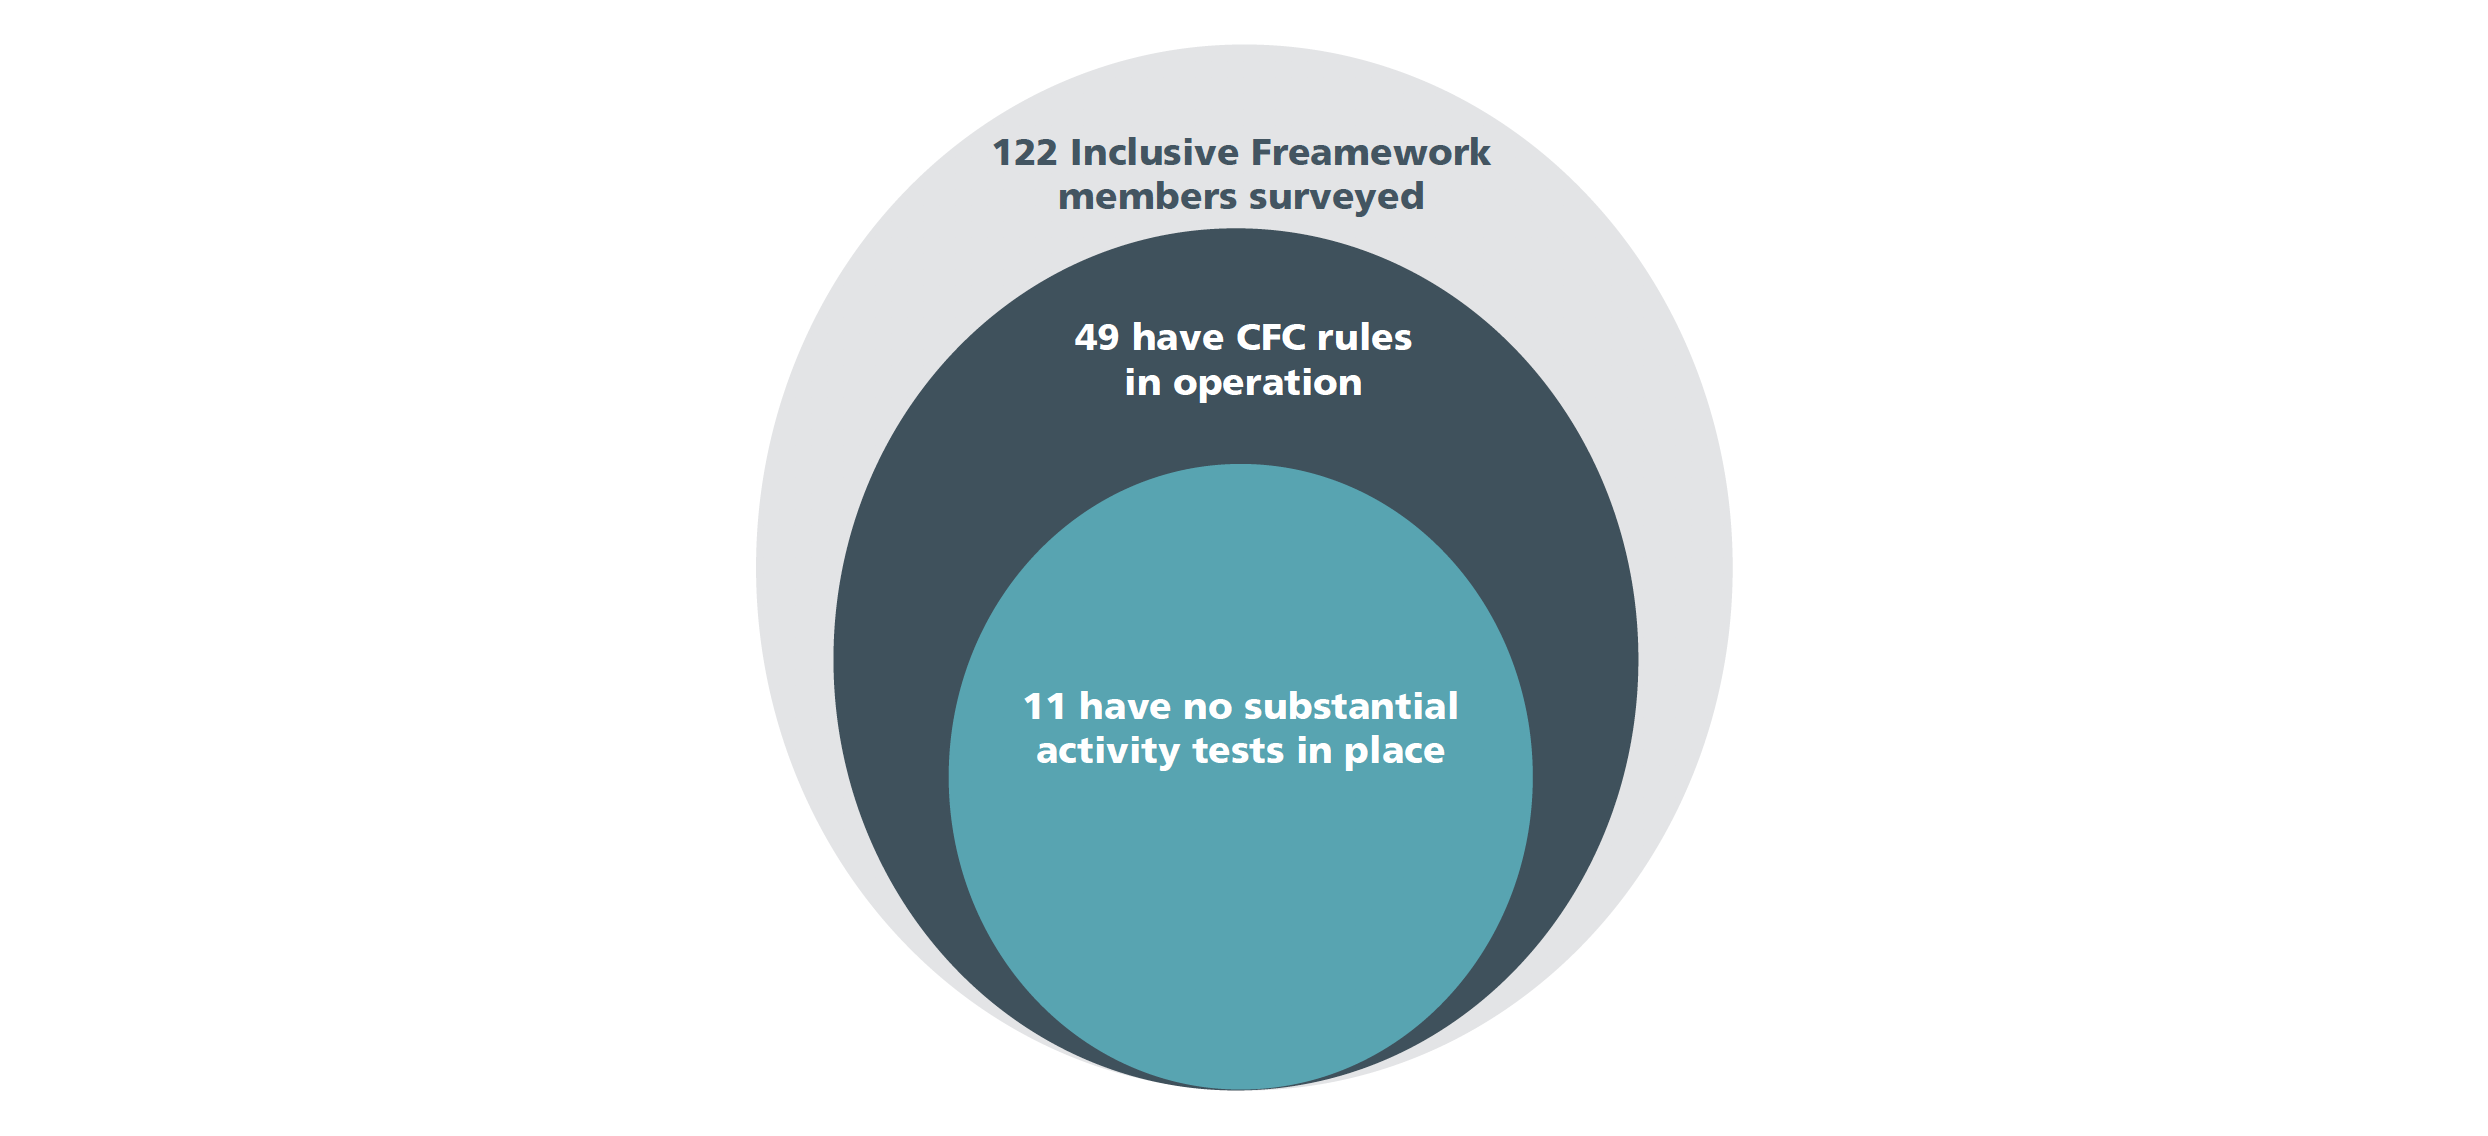
Information on the presence of CFC rules is available for 122 Inclusive Framework member jurisdictions. Of these, 49 jurisdictions had CFC rules in place in 2019. Countries have varying definitions of CFC income, with some applying CFC rules to any type of income while others apply them only to passive income. Countries also vary in exemptions for substantial activity. Of the 49 countries that had CFC rules in 2019, 11 had no substantial activity test in place.
1 Corporate Tax Statistics: Second Edition - OECD
2 Information on China and India not provided
3 OECD/G20 Base Erosion and Profit Shifting Project: Countering Harmful Tax Practices More Effectively, Taking into Account Transparency and Substance - Action 5: 2015 Final Report
4 Reviewing the Tax Treatment of Excessive Debt Financing, Interest Deductions and Other Financial Payments: National Treasury 26 February 2020
5 OECD/G20 Base Erosion and Profit Shifting Project Limiting Base Erosion Involving Interest Deductions and Other Financial Payments: Action 4: 2015 Final Report
6 OECD/G20 Base Erosion and Profit Shifting Project Designing Effective Controlled Foreign Company Rules: Action 3: 2015 Final Report
